What is a RACI chart? Get Project Clarity
Project management can be a labyrinth of responsibilities, goals, and deliverables. For project managers, team leaders, and HR professionals, keeping everyone aligned and on track can sometimes be hard to achieve. That's where the RACI chart comes in. It's an easy but effective tool that can improve how your team works.
What Exactly is a RACI Chart?
The RACI chart is a simple, yet powerful framework designed to clarify roles and responsibilities in a project. RACI stands for Responsible, Accountable, Consulted, and Informed. Each term defines a specific role, making it easier to distribute tasks and improve overall project efficiency.
At its core, the RACI chart helps define who is responsible for what. This eliminates ambiguity and ensures that everyone knows their specific duties. It’s especially useful in complex projects involving multiple teams, where role overlap can lead to confusion and delays.
By clearly defining roles, the RACI chart enhances coordination and streamlines communication. This results in a more organized approach to project management, reducing the risk of missed deadlines or duplicated efforts.
Understanding the RACI Framework
Breaking Down RACI Roles
Here's a breakdown of what each letter stands for:
Responsible: The team member(s) who do the work to complete the task.
Accountable: The person who makes sure the task is completed and has the authority to make decisions.
Consulted: Those whose opinions are sought, typically subject matter experts.
Informed: Individuals who need to know the progress or decisions made but are not directly involved.
So the responsible refers to the individuals who are tasked with completing a specific activity. They are the doers who execute the work. The accountable is the person who is ultimately answerable for the task or project’s outcome. They approve work and ensure the responsibilities are met. The consulted individuals provide input and feedback, while informed parties need to be kept in the loop about progress and outcomes.
How to Create an Effective RACI Chart
Creating a RACI chart involves several straightforward steps:
Identify Tasks: List all the tasks and activities involved in your project.
Define Roles: Determine who will be responsible, accountable, consulted, and informed for each task.
Assign Roles: Fill in the RACI chart by assigning roles to each task.
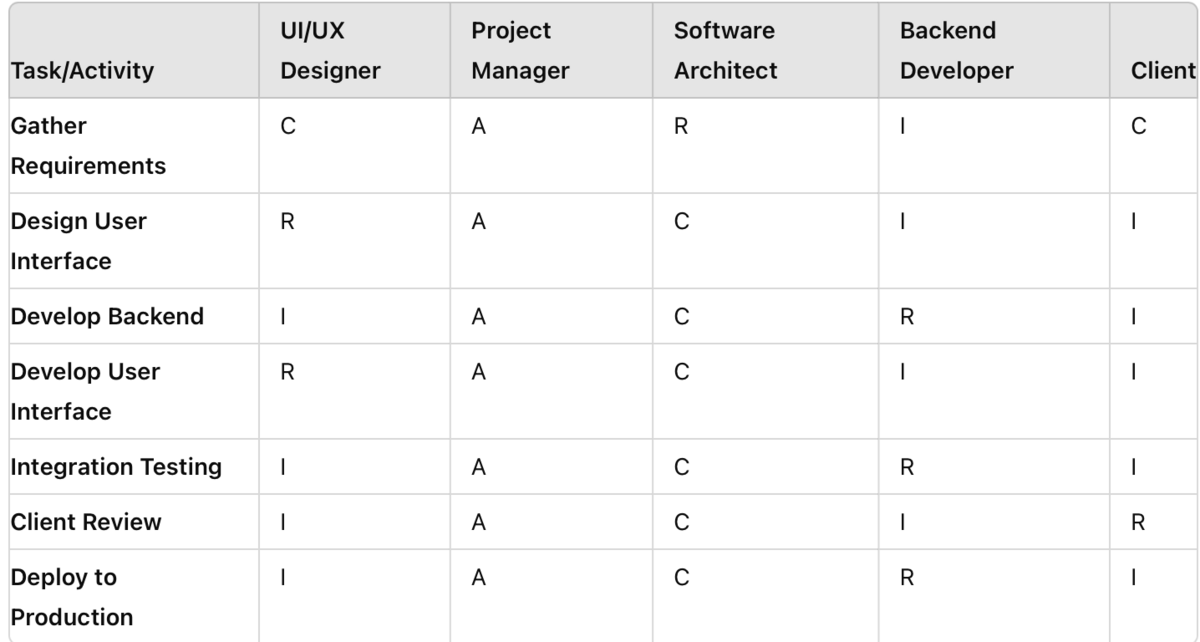
For example, in a software development project, the task "Develop User Interface" might have the UI/UX designer as Responsible, the project manager as Accountable, the software architect as Consulted, and the client as Informed.
To create a RACI chart, start by listing the project tasks on the left-hand side and the team members at the top. For each task, assign the appropriate RACI roles. For instance:

When building a RACI chart, keep the following considerations in mind:
Simplicity: Keep the chart simple and easy to understand.
Balance: Ensure that there is a balance in the distribution of responsibilities to avoid overburdening any one individual or group.
Flexibility: Be flexible and open to making adjustments as the project progresses.
Real-World Examples of RACI Charts in Action
To understand the practical application of RACI charts, let's look at some real-world examples:
Marketing Campaign: In a digital marketing campaign, the marketing manager might be Accountable, individual team members Responsible for creating content, the client Consulted on key decisions, and the sales team Informed about campaign progress.
Product Launch: For a product launch, the product manager could be Accountable, the development team Responsible for finalizing features, the marketing team Consulted for promotional strategies, and stakeholders Informed about timelines.
These examples illustrate how RACI charts can be tailored to various types of projects and industries.
Tools and Software for RACI Chart Creation
While you can create RACI charts manually, several tools and software can streamline the process:
Microsoft Excel: A versatile tool that many are already familiar with.
Teamioo: Allows for visual project management and can incorporate RACI elements.
Smartsheet: Offers specialized templates for creating RACI charts.
These tools not only facilitate the creation of RACI charts but also make it easier to share and update them as needed.
We encourage you to integrate the RACI model into your project management processes. Start with a pilot project to see how it fits with your team dynamics and workflow. The RACI chart is more than just a tool—it’s a game-changer for project managers and team leaders. By clarifying roles and responsibilities, it enhances communication, boosts accountability, and ensures projects run smoothly.
Whether you're launching a marketing campaign, developing software, or planning an event, the RACI chart can provide the structure and clarity needed to succeed. Take the time to create and implement a RACI chart for your projects, and experience the benefits firsthand.